
Notebooks
Python Integration
DBCode Notebooks support Python cells, allowing you to combine SQL queries with Python data analysis tools. This powerful integration enables you to query your database with SQL and then process, visualize, and analyze the results using Python libraries like pandas, matplotlib, and numpy.
Prerequisites
Section titled “Prerequisites”To use Python in DBCode Notebooks, you need to have the Jupyter extension installed in VS Code.
Using Python Cells
Section titled “Using Python Cells”Adding a Python Cell
Section titled “Adding a Python Cell”When creating a new cell in a DBCode Notebook, you can choose the language for that cell. Simply change the language selector from “SQL” to “Python” to create a Python cell.
Selecting a Python Kernel
Section titled “Selecting a Python Kernel”The first time you execute a Python cell in a notebook, DBCode will discover any running Jupyter kernels and prompt you to select one. If you have multiple Jupyter notebooks open with different kernels, you’ll be able to choose which kernel to use.
Your kernel selection is saved with the notebook, so you won’t be prompted again unless you explicitly change it. You can change the kernel at any time by clicking on the kernel selector in the cell status bar.
The kernel selector shows the Python environment and the Jupyter notebook it’s running from (e.g., “Python - analysis.ipynb”), making it easy to identify which kernel you’re using.
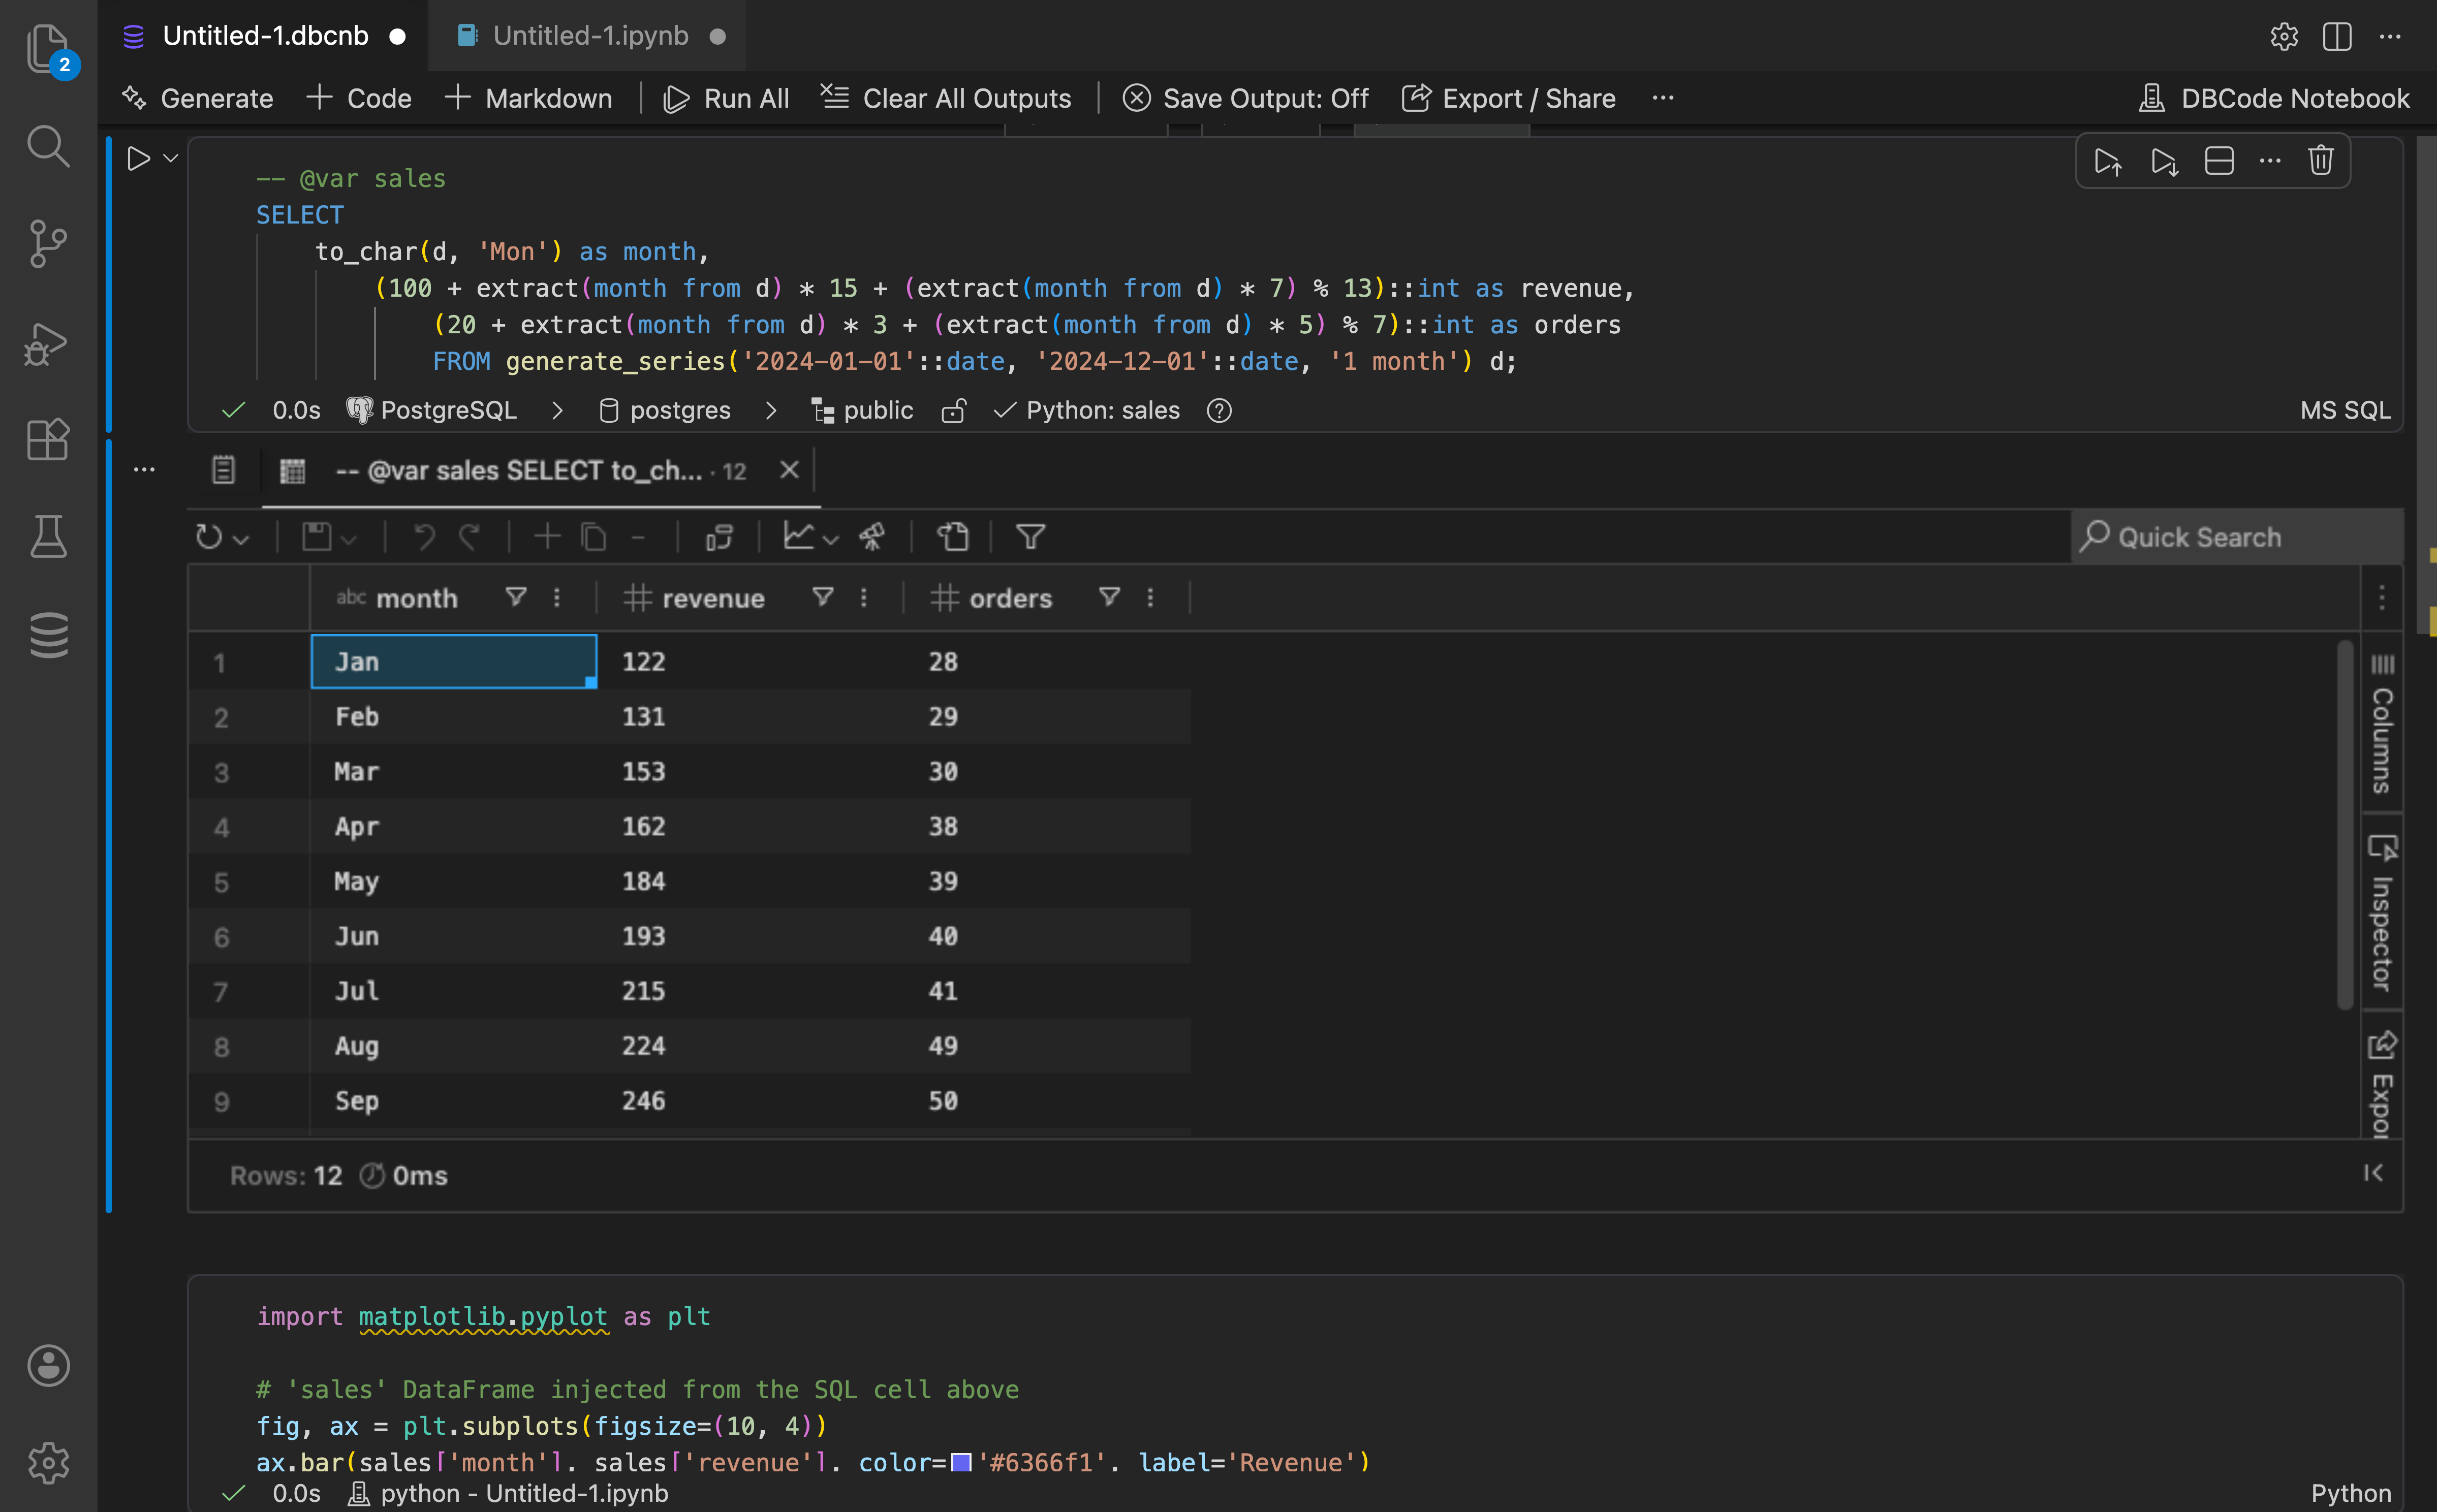
SQL to Python Injection
Section titled “SQL to Python Injection”One of the most powerful features of Python integration is the ability to automatically inject SQL query results into Python as pandas DataFrames. This allows you to seamlessly transition from querying data to analyzing it.
Enabling Injection
Section titled “Enabling Injection”To inject SQL results into Python:
- Add
@varannotations to your SQL cells as comments - Click the Python injection toggle in the SQL cell’s status bar to enable injection
- Select a Python kernel when prompted (if not already selected)
- Execute the SQL cell
- The results will be automatically available in your selected Python kernel as pandas DataFrames
Note: You can inject SQL results to external Jupyter notebooks - the DBCode notebook doesn’t need to contain Python cells.
Using @var Annotations
Section titled “Using @var Annotations”The @var annotation tells DBCode which variable name to use when injecting the result set into Python. Add it as a SQL comment before your query:
-- @var usersSELECT * FROM users WHERE created_at > NOW() - INTERVAL '7 days';
-- @var ordersSELECT * FROM orders WHERE status = 'pending';
Multiple Result Sets
Section titled “Multiple Result Sets”If your SQL cell produces multiple result sets (e.g., multiple SELECT statements), you can use multiple @var annotations. They are matched to result sets by order:
-- @var user_countSELECT COUNT(*) FROM users;
-- @var order_countSELECT COUNT(*) FROM orders;
-- @var product_countSELECT COUNT(*) FROM products;
The first @var annotation gets the first result set, the second gets the second result set, and so on.
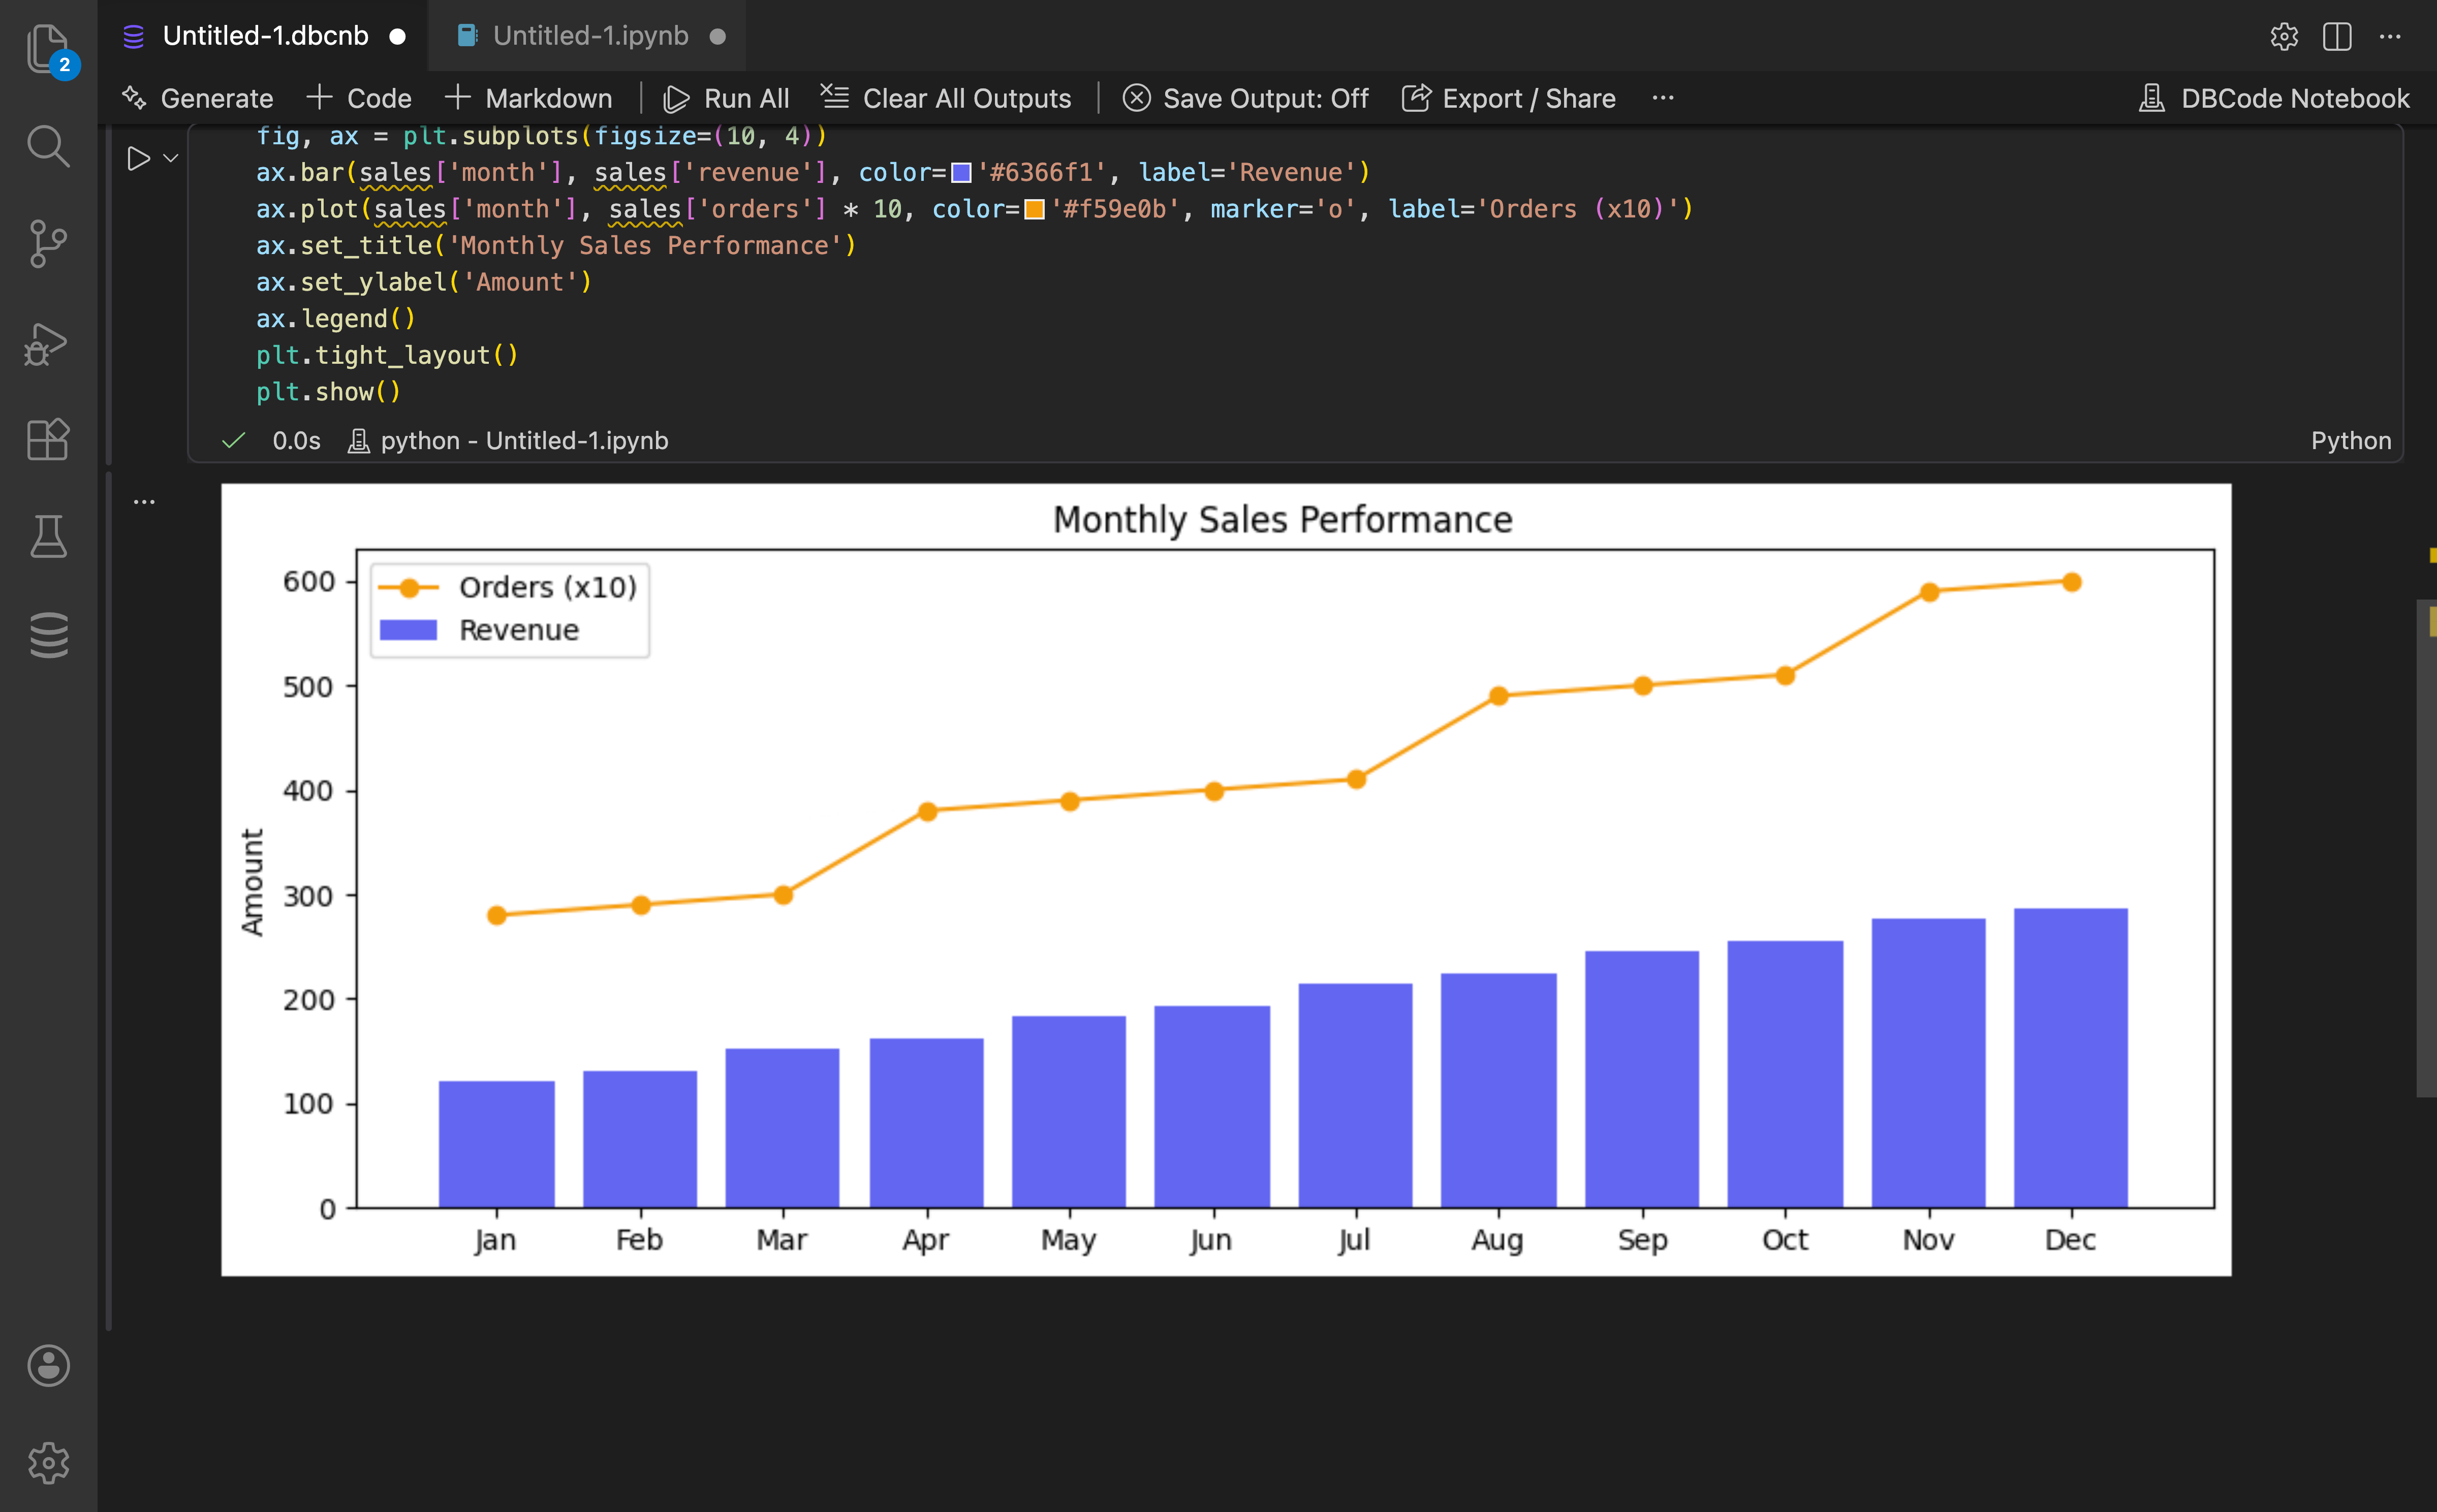
Using Injected Data in Python
Section titled “Using Injected Data in Python”Once injection is enabled and the SQL cell is executed, the variables are immediately available in Python cells:
import pandas as pdimport matplotlib.pyplot as plt
# The 'users' DataFrame is automatically availableprint(f"Total users: {len(users)}")print(users.head())
# Analyze and visualizeuser_summary = users.groupby('country').size()user_summary.plot(kind='bar')plt.title('Users by Country')plt.show()
Injection Help
Section titled “Injection Help”When Python injection is enabled, a help icon (?) appears in the cell status bar. Click it to:
- See which variables will be created
- View the
@varannotations found in the cell - Access this documentation
Data Types
Section titled “Data Types”SQL results are automatically converted to appropriate Python types:
- Numbers: Integers and decimals become Python int/float
- Strings: Text becomes Python str
- Dates/Times: Timestamps are preserved as pandas datetime objects
- NULL values: Converted to pandas NaN
Example Workflow
Section titled “Example Workflow”Here’s a complete example of using SQL and Python together:
SQL Cell 1:
-- @var sales_dataSELECT date_trunc('month', order_date) as month, SUM(amount) as total_sales, COUNT(*) as order_countFROM ordersWHERE order_date >= '2024-01-01'GROUP BY date_trunc('month', order_date)ORDER BY month;Python Cell 1:
import pandas as pdimport matplotlib.pyplot as plt
# Calculate growth ratesales_data['growth_rate'] = sales_data['total_sales'].pct_change() * 100
# Create visualizationfig, (ax1, ax2) = plt.subplots(2, 1, figsize=(12, 8))
# Sales trendax1.plot(sales_data['month'], sales_data['total_sales'], marker='o')ax1.set_title('Monthly Sales Trend')ax1.set_ylabel('Total Sales ($)')
# Growth rateax2.bar(sales_data['month'], sales_data['growth_rate'])ax2.set_title('Month-over-Month Growth Rate')ax2.set_ylabel('Growth (%)')ax2.axhline(y=0, color='r', linestyle='--')
plt.tight_layout()plt.show()
Tips and Best Practices
Section titled “Tips and Best Practices”- Variable Names: Use descriptive variable names in
@varannotations (e.g.,@var monthly_revenueinstead of@var data) - One Query Per Variable: While you can have multiple result sets, consider using separate SQL cells for complex queries to keep your analysis organized
- Check Your Data: Always inspect the injected DataFrame with
.head(),.info(), or.describe()before analyzing - DataFrame Operations: All standard pandas operations work on injected DataFrames (filtering, grouping, joining, etc.)
- Install Libraries: Make sure required Python libraries (pandas, matplotlib, etc.) are installed in your Python environment
Troubleshooting
Section titled “Troubleshooting”No Python Kernel Found
Section titled “No Python Kernel Found”If you don’t have any running Jupyter kernels, DBCode will prompt you to open a Jupyter notebook and run a cell first. This initializes a kernel that DBCode can connect to.
Variables Not Available
Section titled “Variables Not Available”Make sure:
- Python injection is enabled (toggle in SQL cell status bar)
- The SQL cell has been executed after enabling injection
- Your
@varannotations are correctly formatted as comments - You’re using the correct variable name in Python
Duplicate Variable Names
Section titled “Duplicate Variable Names”Each @var annotation must have a unique name within the notebook. If you use the same variable name multiple times, DBCode will show an error and prevent injection.
Next Steps
Section titled “Next Steps”- Learn about Cell Locking to work with multiple database connections
- Explore Exporting notebooks with Python code and visualizations
- Check out Query Parameters for dynamic SQL queries