
QueryUnderstand and debug
Execution Plans
Execution Plans help you see how your database executes a query so you can debug, tune performance, and avoid costly mistakes. DBCode supports database native plan generation (EXPLAIN and, where supported, ANALYZE/actual plans) and provides an interactive Plan Explorer for deep inspection.
- EXPLAIN: Generates the estimated execution plan without running the query.
- ANALYZE / Actual Plan: Executes the query and returns actual timing and row counts (only on engines that support it).
- Plan Explorer: An interactive view to explore nodes, costs, timings, cardinality, predicates, and potential bottlenecks.
How To Use
Section titled “How To Use”You can run Execution Plans from both the SQL Editor and DBCode Notebooks:
- Write or select a SQL query.
- Choose one of:
- Explain: Runs the database’s EXPLAIN for the selected query.
- Analyze: Runs the database’s ANALYZE/actual plan (where supported) and returns runtime metrics.
- View results in the Plan Explorer panel.
Tip: If no text is selected, DBCode uses the active statement under your cursor.
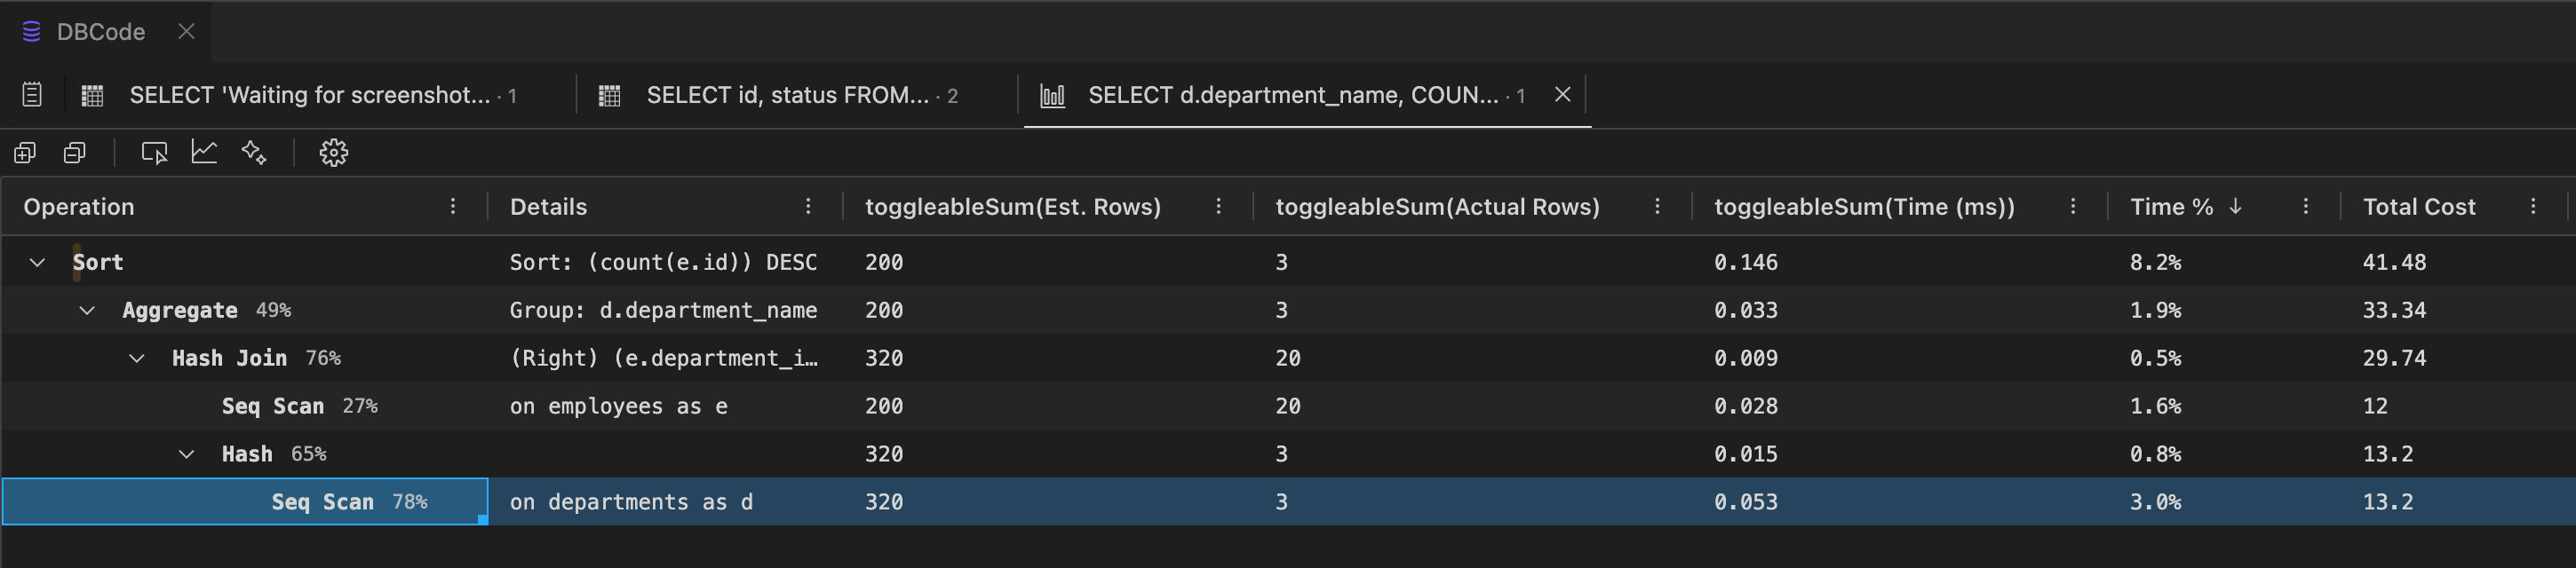
Plan Explorer
Section titled “Plan Explorer”The Plan Explorer renders plans in a clear, navigable tree so you can quickly find hotspots and understand operator behavior.
- Node Tree: Expand/collapse nodes to explore scans, joins, sorts, aggregates, etc.
- Metrics At A Glance: View estimated vs. actual rows, cost, and time (when available).
- Predicates & Filters: Inspect join conditions, index usage, filter predicates, and projections.
- Hotspot Highlighting: Identify the most expensive operators to focus tuning efforts.
- Search & Navigation: Quickly jump to nodes by name or operator type.
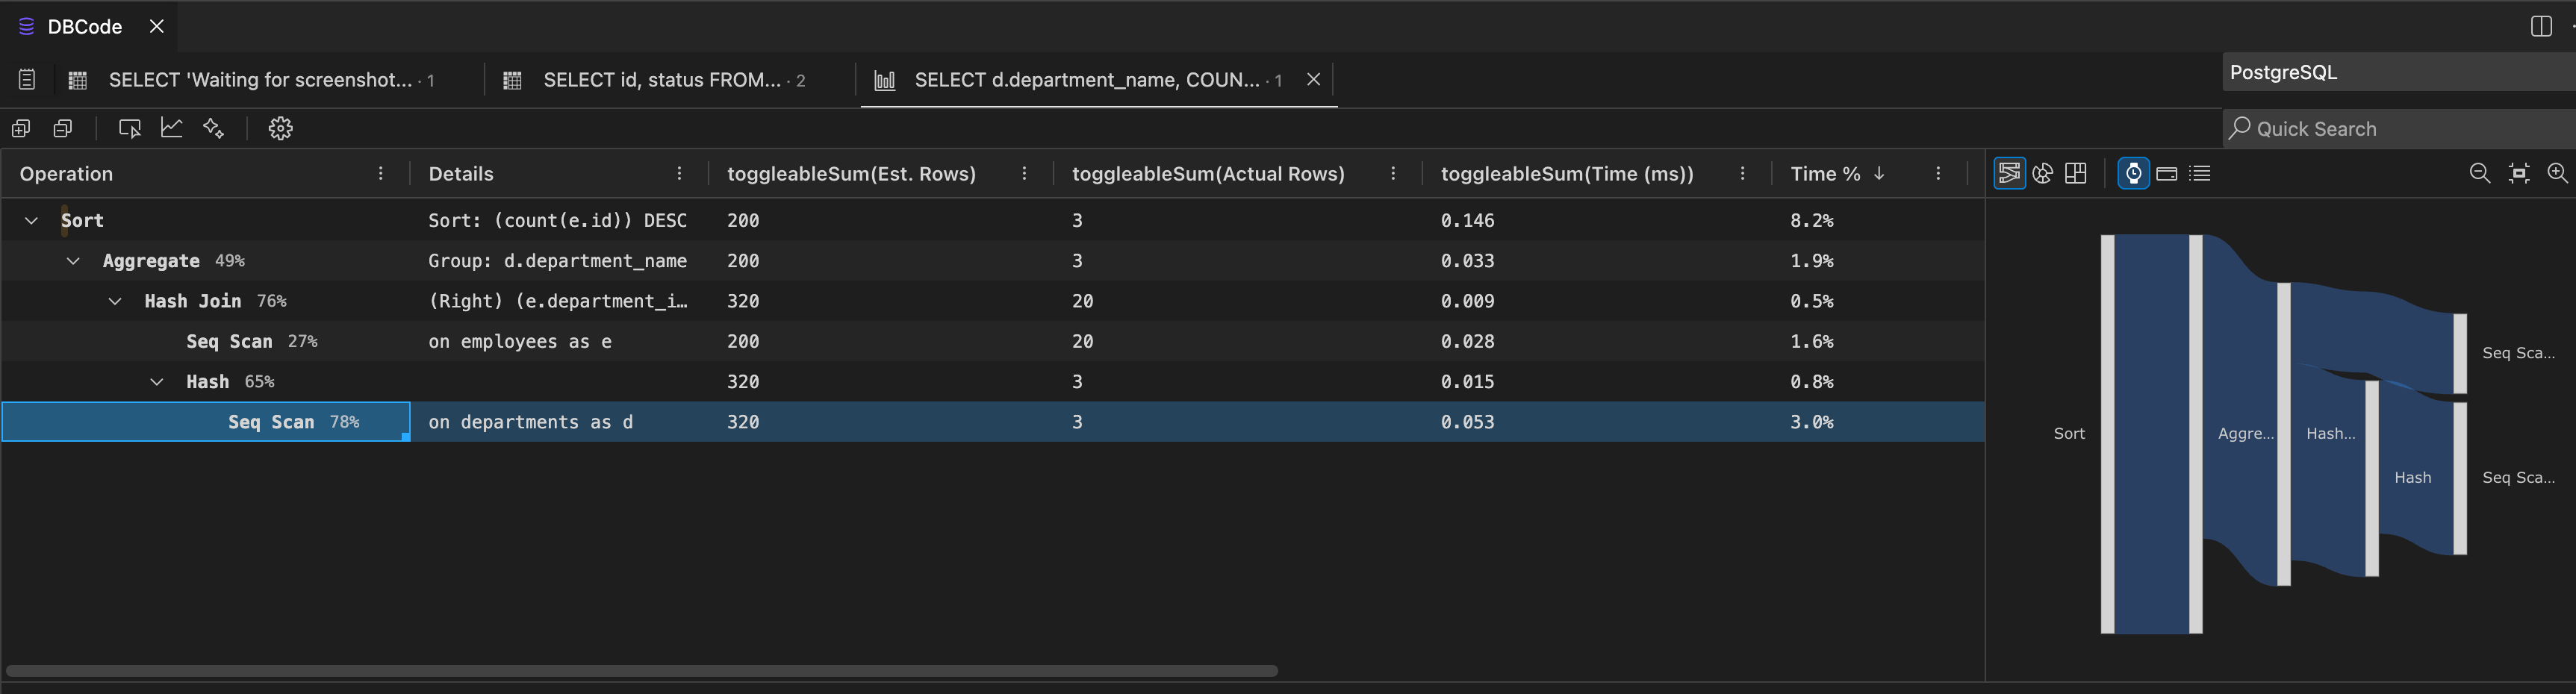
Charts
Section titled “Charts”Open the Charts panel to visualize the execution plan as a Sankey diagram, Sunburst, or Treemap. Toggle between Time, Cost, and Rows to highlight different aspects of the plan.
Plan Explorer interactive example. Open in a new tab
Supported Engines
Section titled “Supported Engines”DBCode issues database native commands for plan generation and only shows options that are supported by your engine and permissions. Common examples include:
- PostgreSQL: EXPLAIN, EXPLAIN ANALYZE
- MySQL/MariaDB: EXPLAIN (ANALYZE available on modern versions)
- SQLite: EXPLAIN QUERY PLAN
- SQL Server: Estimated vs. actual execution plans
- Oracle: EXPLAIN PLAN
When To Use Explain vs. Analyze
Section titled “When To Use Explain vs. Analyze”- Use EXPLAIN to review the optimizer’s plan safely without executing the query.
- Use ANALYZE to compare estimates with actuals, validate cardinality, and pinpoint miss estimates and slow operators. This will execute the query.
Tuning Workflow
Section titled “Tuning Workflow”- Explain the query to understand operator choices and index usage.
- Identify potential issues (full scans, mismatched join orders, sorts, spills).
- Analyze (where supported) to compare estimated vs. actual rows and timings.
- Apply changes (indexes, rewritten predicates, smaller result sets, better join order).
- Re-run Explain/Analyze to validate improvements.
AI Analysis
Section titled “AI Analysis”The Plan Explorer includes a built-in AI assistant that can analyze your execution plan and provide actionable optimization suggestions.
How It Works
Section titled “How It Works”- Run an Explain or Analyze for your query.
- In the Plan Explorer, open the AI Analysis panel.
- Enter a prompt — or use the default — describing what you want to analyze.
- The assistant reviews your execution plan, the original SQL query, and your database schema, then returns:
- Identified bottlenecks with specific node references
- Explanations of performance issues in plain language
- Suggested SQL improvements (indexes, query rewrites) as ready-to-use code blocks
Model Selection
Section titled “Model Selection”The AI assistant uses whichever provider is active in your DBCode AI settings:
- Custom Model — your own OpenAI-compatible endpoint (see Custom Provider)
- GitHub Copilot — if installed and active
- DBCode AI — hosted model, always available as fallback
You can temporarily switch to a different model for a single analysis directly from the assistant panel, without changing your default settings. This is useful when you want a more capable model for a complex plan while keeping a fast model for inline completions.
What Data Is Sent
Section titled “What Data Is Sent”When you request AI analysis, the following is sent to the selected model:
- The execution plan (JSON structure with nodes, costs, timings)
- The original SQL query
- Database schema for tables referenced in the plan (table/column names, types, indexes)
- The database dialect (e.g. PostgreSQL, MySQL)
No credentials, connection strings, or actual data values are sent. See Privacy and Security for details.
Troubleshooting
Section titled “Troubleshooting”- Permissions: Some databases require specific roles/privileges to generate plans.
- Long Running Queries: ANALYZE executes the query; prefer EXPLAIN during iteration.
- Parameter Effects: Different parameter values can lead to different plans; test representative inputs.
- Engine Support: If a button isn’t shown, your database/driver may not support that plan type yet in DBCode.
Execution Plans and the Plan Explorer give you clear visibility into query behavior so you can optimize confidently, without leaving VS Code.