
Monitoring
Monitoring gives you real-time visibility into your database servers directly within VS Code. Track active sessions, performance metrics, locks, replication status, and server info without leaving your editor.
Supported Databases
Section titled “Supported Databases”Monitoring is available for databases that expose server-level statistics. The categories available depend on the database:
| Database | Sessions | Performance | Locks | Replication | System Info |
|---|---|---|---|---|---|
| PostgreSQL | Yes | Yes | Yes | Yes | Yes |
| MySQL / MariaDB | Yes | Yes | Yes | Yes | Yes |
| SQL Server | Yes | Yes | Yes | AlwaysOn only | Yes |
| Oracle | Yes | Yes | Yes | Data Guard only | Yes |
| DB2 | Yes | Yes | Yes | - | Yes |
| Snowflake | Yes | Yes | - | - | Yes |
| MongoDB | Yes | Yes | Yes | Replica sets only | Yes |
| Redis / Valkey | Yes | Yes | - | - | Yes |
| Cassandra / ScyllaDB | Yes | Yes | - | - | Yes |
| Elasticsearch / OpenSearch | Yes | Yes | - | - | Yes |
| Neo4j / Memgraph | Yes | Yes | - | - | Yes |
| InfluxDB | Yes | Yes | - | - | Yes |
| Databricks | Yes | Yes | - | - | Yes |
| Hive / Impala | Yes | Yes | - | - | Yes |
| DynamoDB | Yes | Yes | - | - | Yes |
Embedded databases (SQLite, DuckDB, PGLite) do not have a server process and are not supported.
Opening the Monitor
Section titled “Opening the Monitor”- From the tree - Expand a connection, click the Monitoring node, and select a category.
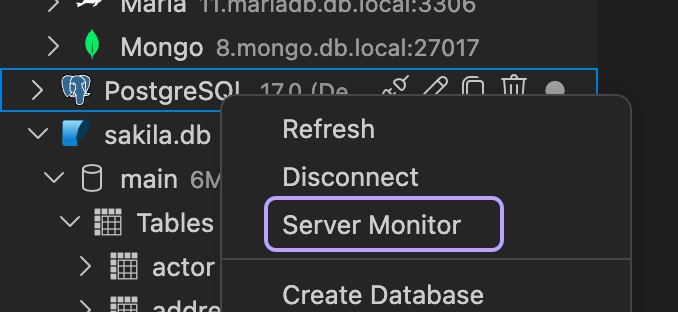
- Right-click a connection - Select Server Monitor from the context menu.
- Command Palette - Run DBCode: Server Monitor and pick a connection.
If a monitoring panel is already open for a connection, it will be focused rather than opening a duplicate.
Health Summary
Section titled “Health Summary”A row of metrics in the panel header shows the at-a-glance health of the server. It typically includes:
- Sessions - Count of active client sessions
- Long-running - Count of sessions whose duration exceeds the alert threshold (only shown when greater than zero)
- Key metrics that have known healthy ranges (cache hit ratio, CPU usage, deadlocks per second, etc.)
Each metric shows its current value colored by status: green when healthy, yellow when warning, red when critical. Thresholds are encoded per-metric and per-driver (for example, cache hit ratio below 95% is yellow, below 90% is red).
Sessions
Section titled “Sessions”The Sessions tab shows all active connections to the server. Each row includes the user, client app, current query, session state, and duration. The columns shown depend on the database. PostgreSQL shows wait events and application name, MySQL shows the command type and thread state, SQL Server shows the program name and command.
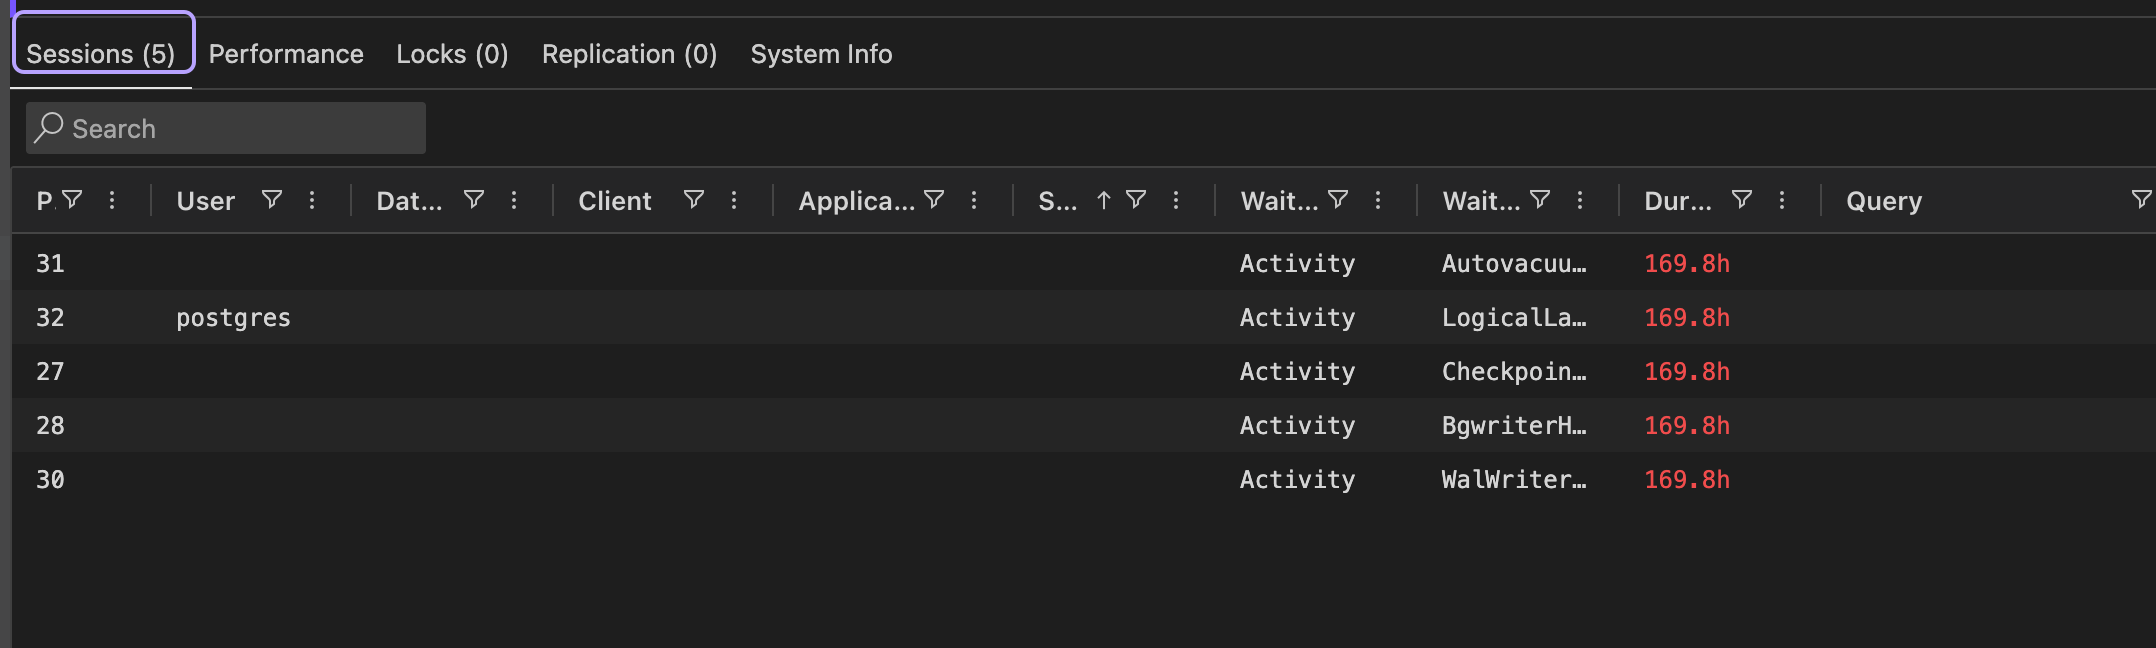
Long-running queries are highlighted: rows whose duration exceeds the configured threshold get a yellow or red tint, and a notification appears with a one-click option to kill the session.
Actions
Section titled “Actions”Right-click a session row for available actions:
- Cancel Query - Stops the running query but keeps the session connected. Available on PostgreSQL, MySQL, Oracle, and Snowflake.
- Kill Session - Terminates the connection entirely. Available on all databases that support monitoring.
Both actions require confirmation. The context menu only shows actions the connected database supports.
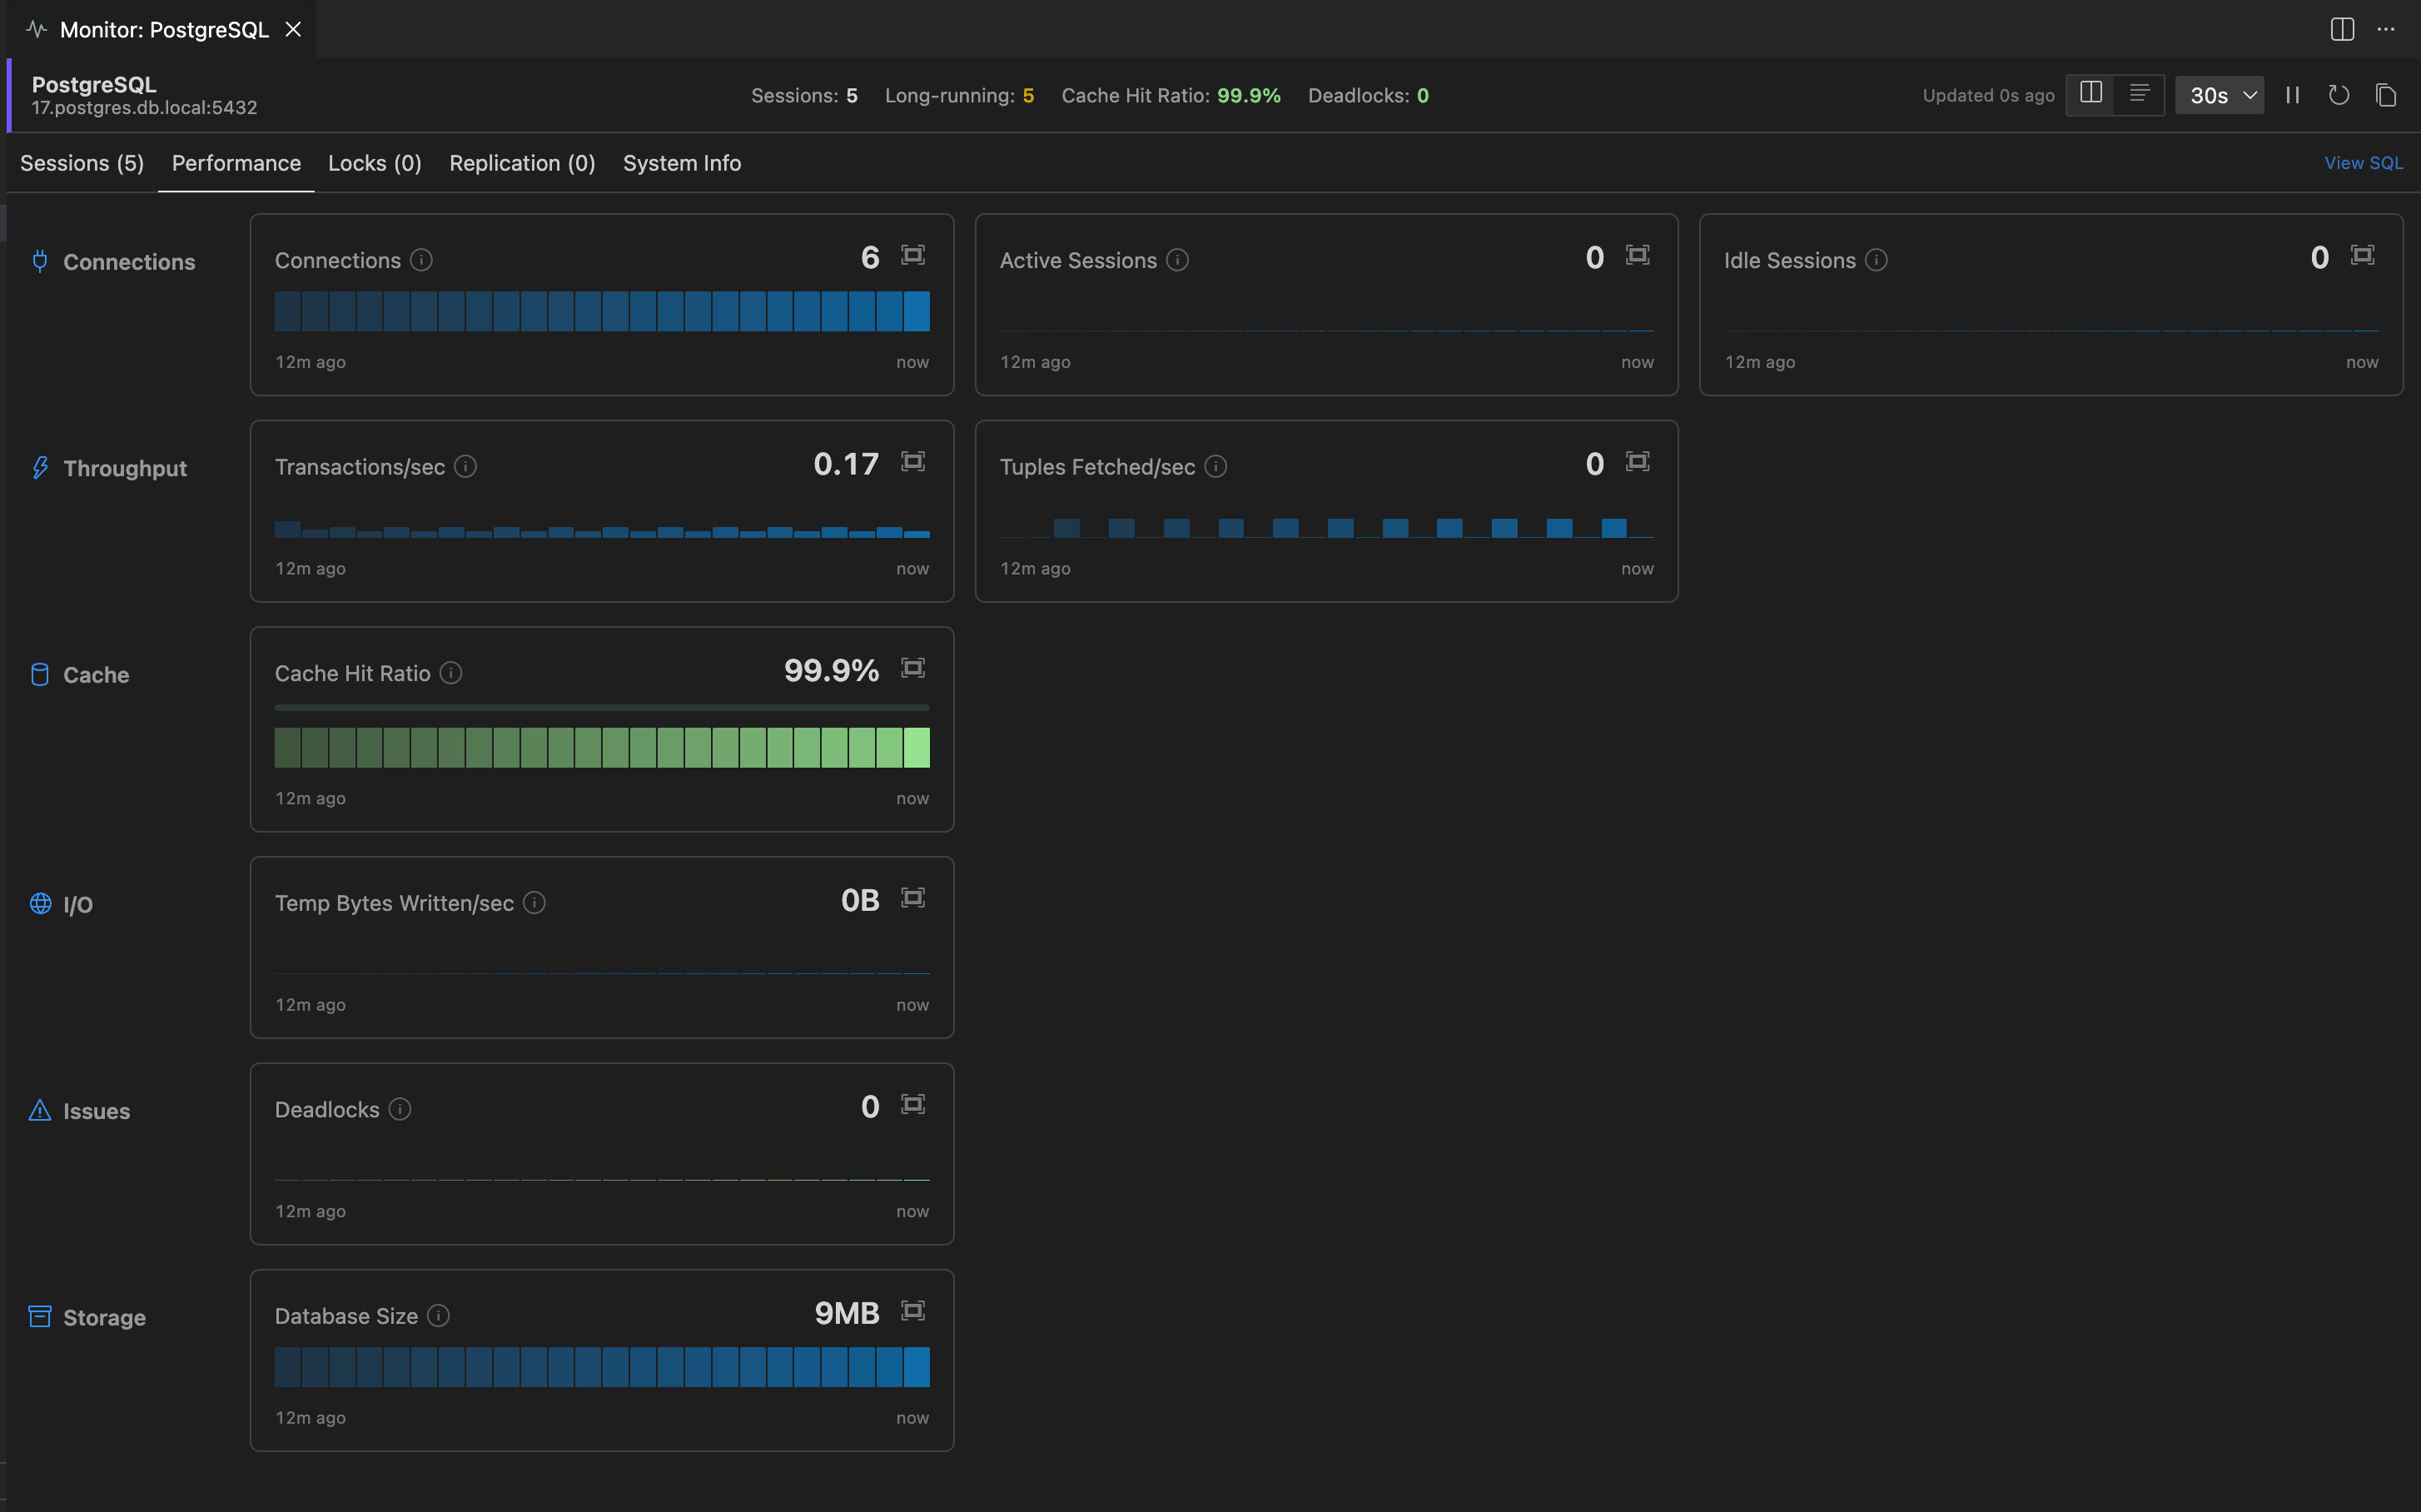
Performance
Section titled “Performance”The Performance tab shows server metrics organized into groups (Connections, Throughput, Cache, Memory, CPU, Issues, I/O, Storage). Each group is a horizontal strip of cards with the group label on the left. Card width adapts to the largest group on the panel so every card lines up regardless of how many metrics are in its group.
Metric cards
Section titled “Metric cards”Each card shows:
- The metric label, with a small info icon when a description is available. Hover the icon (or the label) to read what the metric measures and what healthy values look like.
- The current value, formatted in the metric’s natural unit (count, bytes, percent, ms, ratio).
- A progress bar when the metric has a known maximum.
- A sparkline showing the recent history. Bars are individually colored: green when the historical value was healthy, yellow for warning, red for critical, so you can spot when a metric was bad even after it has recovered.
The cards retain up to 10 hours of history. The compact view always shows the latest 60 samples.
Sparkline interactivity
Section titled “Sparkline interactivity”- Hover any bar to see that sample’s value, local clock time, and how long ago it happened. The hover state propagates across every other card so you can read what every metric was doing at the same point in time.
- Click a bar to pin the hover state. Click it again (or a different bar) to move or release the pin.
- Click the expand icon on a card to grow it inline and reveal the full retained history. Multiple cards can be expanded at once for side-by-side correlation. Click the icon again to collapse.
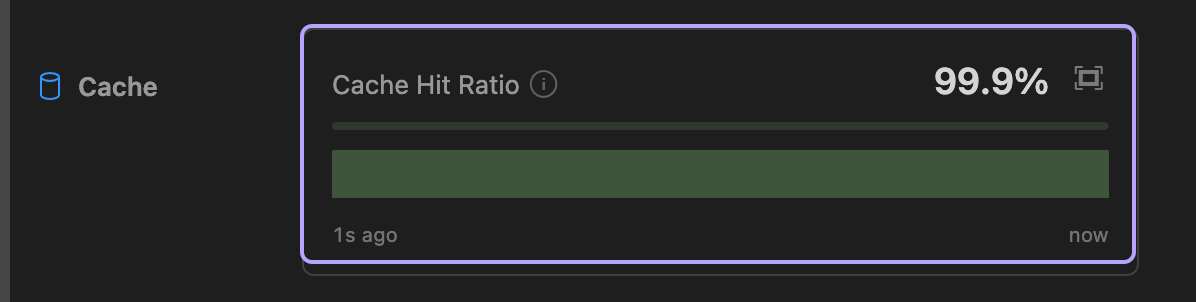
Common metrics
Section titled “Common metrics”The exact set depends on the database server, but common metrics include:
- Connections - Current connection count against the server maximum
- Throughput - Transactions, queries, or operations per second
- Cache Hit Ratio - How effectively the database is using its buffer cache
- Memory Used - Memory consumed by the database process
- CPU Utilization - Percentage of CPU used by the database process
- Deadlocks per second / Lock Waits - Indicators of transaction contention
- Slow Queries / Temp Disk Tables - Workload symptoms
- Database Size - Total storage used
The Locks tab shows current database locks, helping you identify blocking situations. Key information includes the lock type, mode, whether the lock has been granted, and which session is the blocker. Locks are nested under their blocker so you can see the dependency tree at a glance.
Replication
Section titled “Replication”The Replication tab shows the state of database replication when configured. The information varies by database:
- PostgreSQL - Streaming replication lag (write, flush, replay), LSN positions, subscriber state
- MySQL / MariaDB - IO/SQL thread status, seconds behind source, relay log position
- SQL Server - AlwaysOn availability group replica states and synchronization health
- Oracle - Data Guard transport and apply lag
- MongoDB - Replica set member states, health, and optime
This tab only appears for databases where replication monitoring is supported. It shows empty if replication is not configured on the server.
System Info
Section titled “System Info”The System Info tab shows server-level metadata that doesn’t change during a session, grouped by section (Server, Host, Database). Typical entries include the server version and edition, host CPU count and memory, recovery model, collation, and compatibility level.
This data is fetched once on panel open and never refreshed automatically (it doesn’t change). Closing and reopening the panel will fetch it fresh.
View Modes
Section titled “View Modes”Toggle between two layouts using the buttons in the header:
- Tabbed - One category at a time with a tab bar (default)
- All Sections - All categories stacked vertically. Grid sections can be resized by dragging.
Your preference is saved automatically.
Refresh
Section titled “Refresh”Data refreshes automatically on a configurable interval (5s, 10s, 30s, or 60s, defaulting to 30s). Use the pause button to freeze the display while examining data, or click refresh for an immediate update.
The refresh interval is saved per connection, so each connection remembers your preferred rate. Expanded cards are also remembered between panel sessions.
Sessions, Performance, Locks, and Replication are polled on every tick. System Info is fetched once on panel open and stays cached, even on manual Refresh, since the data doesn’t change.
Snapshot
Section titled “Snapshot”Click the copy icon in the panel header to copy a markdown snapshot of every category to your clipboard. The snapshot includes the connection name, current timestamp, current values from the metrics panel, and rows from the grid panels (sessions, locks, replication) formatted as markdown tables. Useful for pasting into a chat message, ticket, or notebook without taking screenshots.
View SQL
Section titled “View SQL”Click View SQL to open the underlying query in a new editor tab connected to the same database. You can modify and run the query directly, useful for building custom monitoring queries.
Availability
Section titled “Availability”Monitoring is available with a Pro or Team subscription. Core users can try the feature up to 3 times.