
QueryUnderstand and debug
Debugger
Stored routines are usually the hardest thing in a database to reason about: you can read the source, but you cannot see what it actually did. DBCode’s debugger runs a function or procedure on the server and pauses it wherever you set a breakpoint, so you can step through the logic line by line and inspect real values as they change.
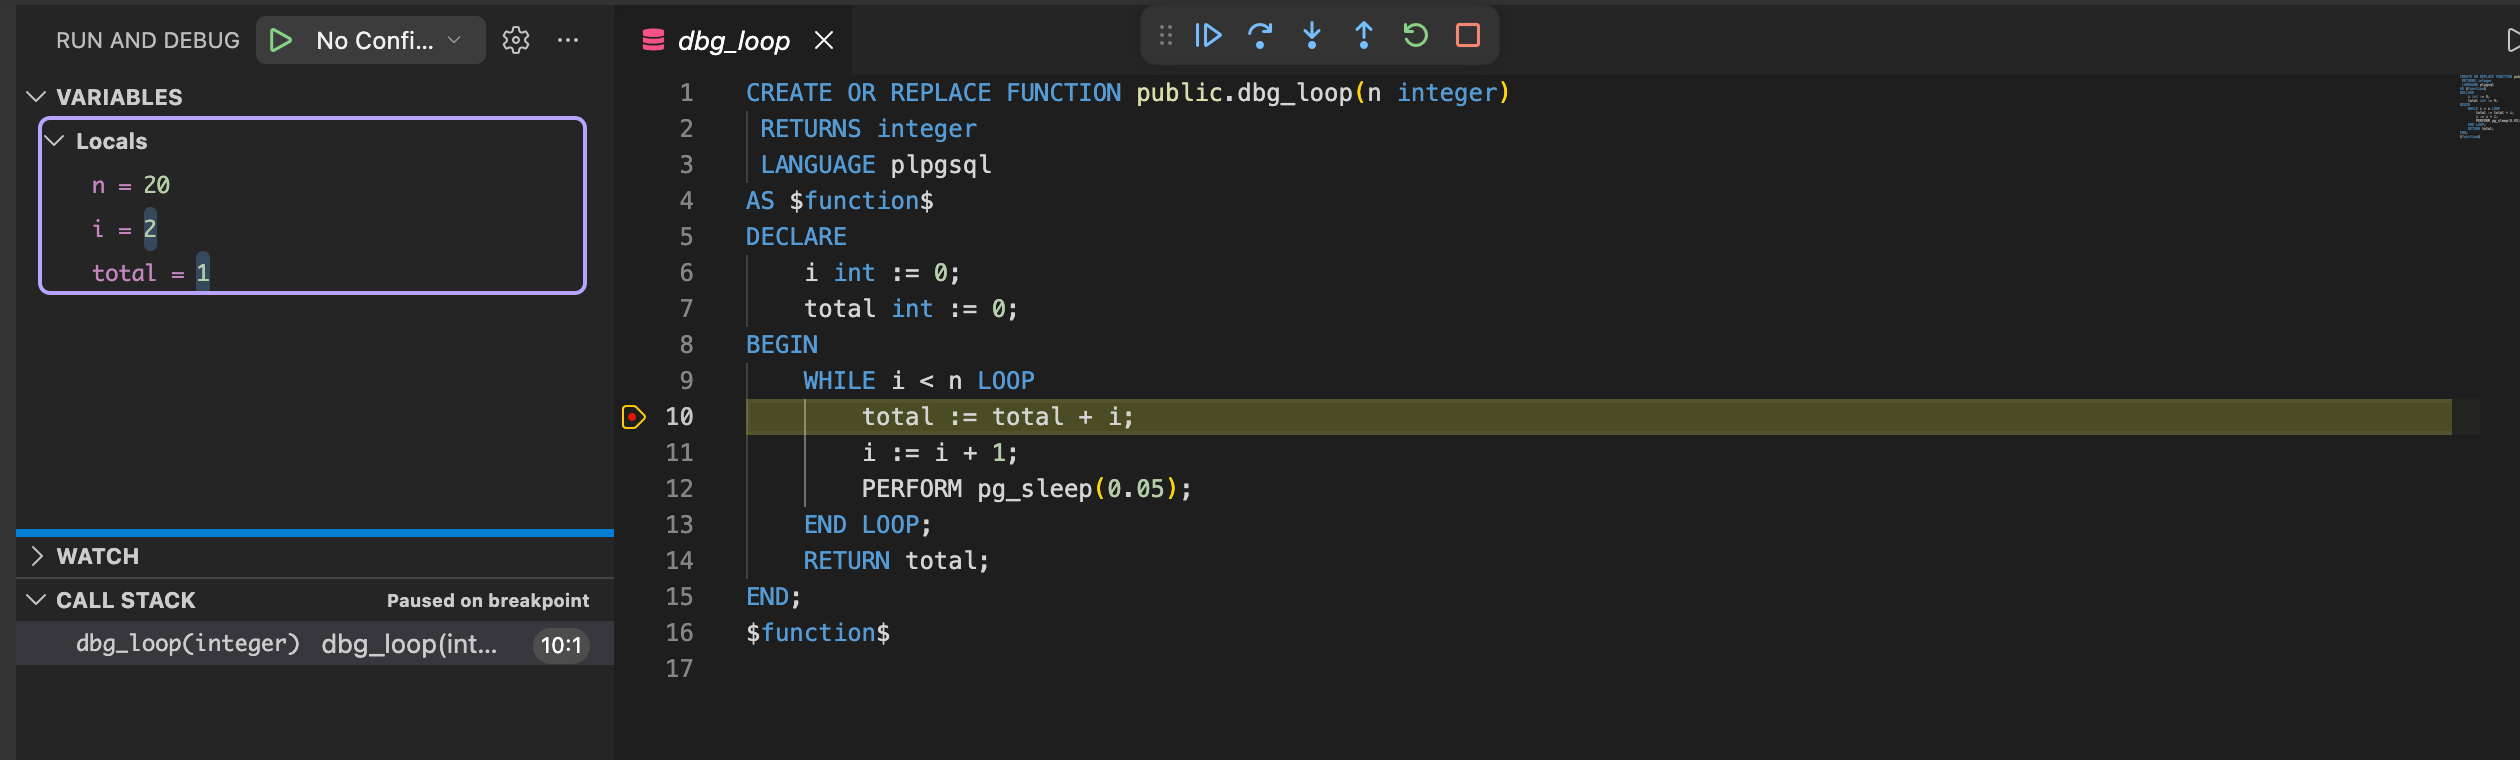
It uses the native VS Code debug UI. Breakpoints go in the gutter of the routine’s source, and the Run and Debug view shows the call stack, variables, and watches exactly as it does for any other language.
Debugging requires a DBCode Pro subscription, and the database server needs to be set up for it. Each database documents its own requirements: see Supported Databases.
Starting a session
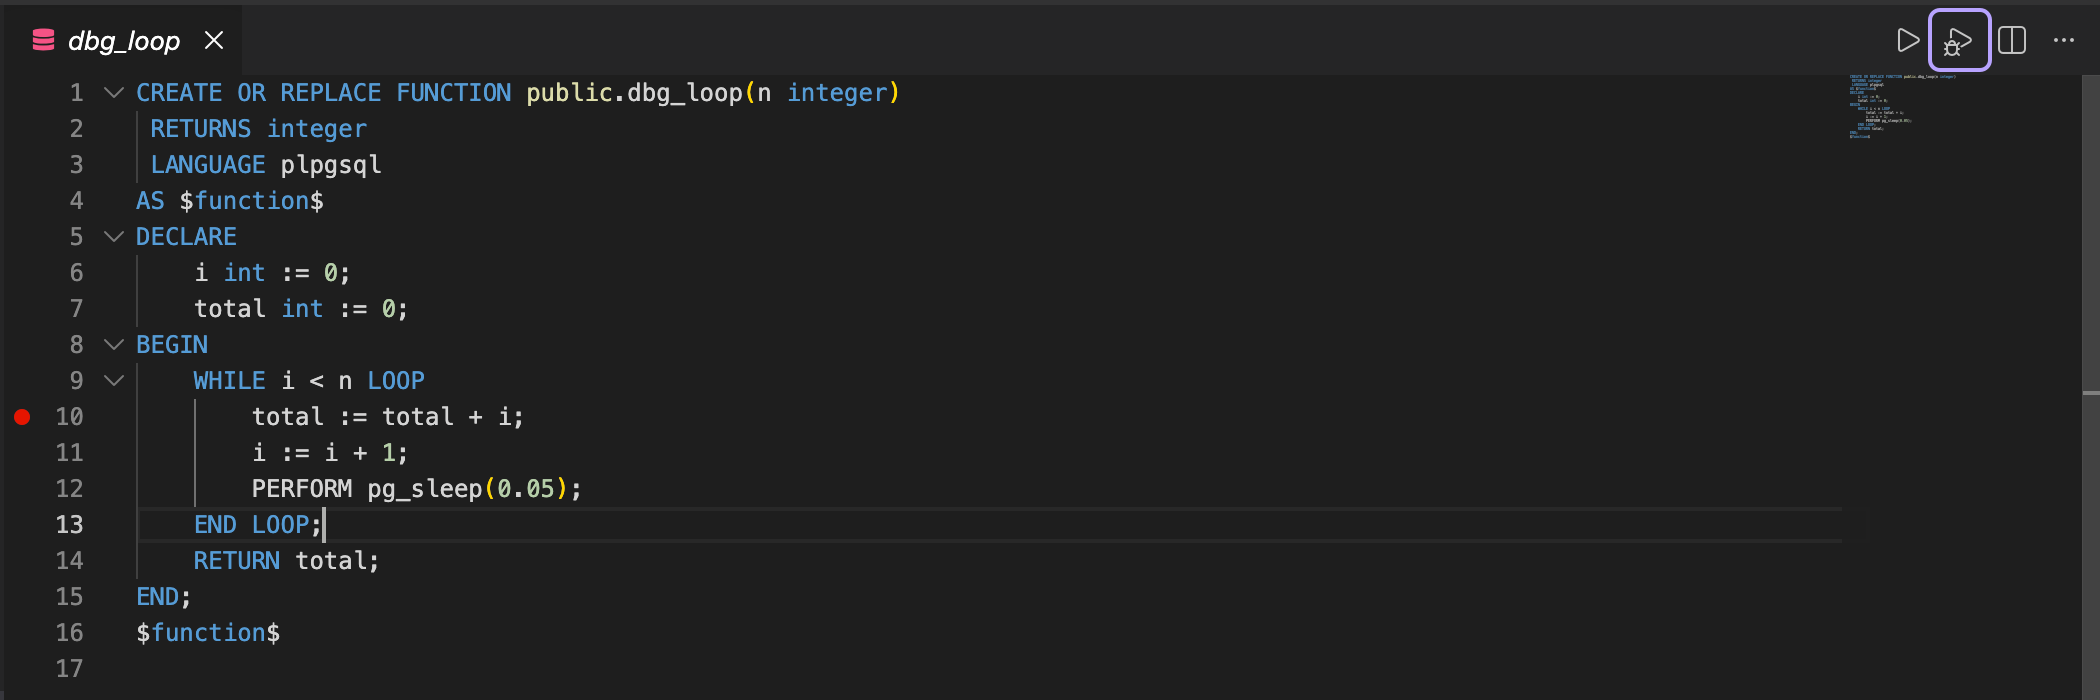
Section titled “Starting a session”Open the function or procedure from the database explorer, then start the debugger any of these ways:
- Click the Debug CodeLens above the routine definition
- Click the Debug icon in the editor title bar
- Right-click the routine in the database explorer and choose Debug
DBCode checks the server is ready, collects any arguments, and runs the routine. If the routine cannot be debugged (the wrong language, for example) it says so and names the reason rather than failing silently.
Debugging runs against the deployed source, which is the definition currently stored on the server. If the editor has unsaved changes, apply or revert them first so the lines you set breakpoints on match the lines the server executes.
Arguments
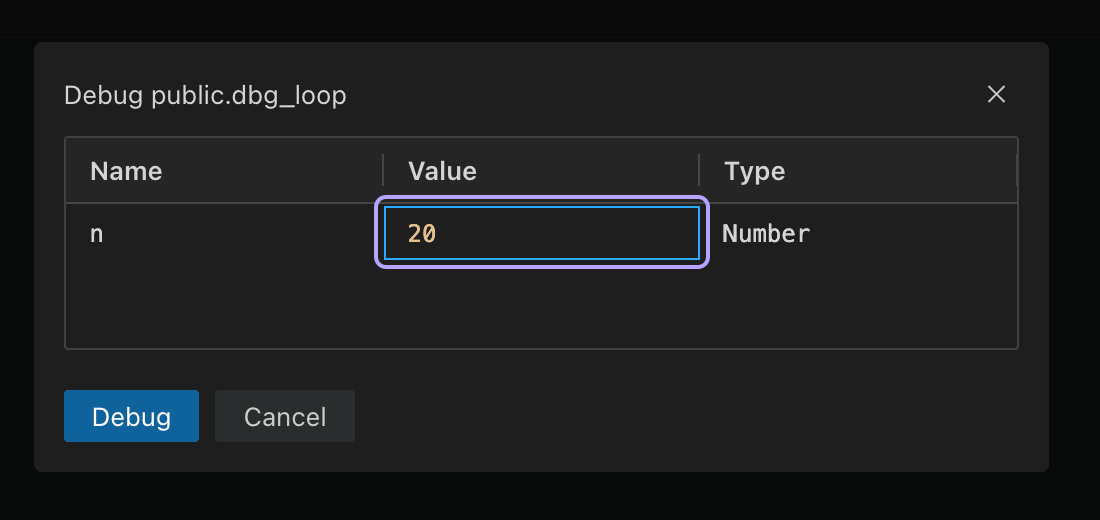
Section titled “Arguments”If the routine takes arguments, DBCode prompts for them in the results panel using the same parameter grid as query parameters, so the values are entered the same way you already enter them for a query.
- Type a value to pass it
- Leave a cell empty to use the routine’s own default, where it has one
- Enter
(null)to pass a SQLNULL - Enter
(empty)to pass an empty string, which an empty cell cannot express for an argument that has a default
Values are remembered per routine, so re-running a debug session keeps what you entered last time.
Stepping and inspecting
Section titled “Stepping and inspecting”Once paused you get the usual debug controls:
| Control | Behaviour |
|---|---|
| Continue | Run to the next breakpoint, or to the end |
| Step Over | Run the current line, then pause on the next one |
| Step Into | Step into a called routine that can also be debugged |
| Step Out | Return from the current routine to its caller, when the database debugger supports it |
| Stop | End the session and cancel the running routine |
The Variables view lists the routine’s variables at the current line, and values update as you step. When the database and variable type support it, you can edit a value while paused to try a different path without changing the source.
The Watch view accepts variable names, so you can pin the few values you care about instead of scanning the whole list.
The Call Stack view shows the nesting when one routine calls another. Selecting a frame shows that frame’s variables.
Output and results
Section titled “Output and results”Routine results land in the DBCode results panel:
- Engines that support live routine messages can stream them into the panel as they happen. For example, PostgreSQL can stream
RAISE NOTICEmessages from PL/pgSQL - When the routine finishes, whatever it returns is shown as a normal result tab, the same as running it directly
Connections
Section titled “Connections”Debug sessions use engine-specific dedicated resources that are separate from the connection pool used by ordinary queries.
- PostgreSQL opens two dedicated database connections: one executes the routine, and the other drives stepping and reads variables.
- Db2 opens one dedicated execution connection and a temporary callback listener on the extension host. Db2 must be able to reach that listener.
- Oracle opens two dedicated Thin mode database connections: one executes the routine, and the other drives stepping and reads variables.
Dedicated debug connections are not released for inactivity, so you can inspect a breakpoint without the session reconnecting to a different backend. The Editor Connection Idle Timeout does not apply to them. Each engine closes its dedicated resources when the session ends.
Limits
Section titled “Limits”- Step Out is available for Db2 and Oracle, but not PostgreSQL
- Pause cannot interrupt a routine mid-run; use a breakpoint to stop where you need
- Watch expressions accept variable names only, not arbitrary expressions
- Variable editing depends on the database and variable type
- Breakpoints apply to the deployed source, so a routine that is redeployed while paused ends the session
Supported Databases
Section titled “Supported Databases”| Database | Requirements |
|---|---|
| PostgreSQL | The plugin_debugger plugin loaded, the pldbgapi extension installed, a superuser or routine-owner role, and a LANGUAGE plpgsql routine |
| IBM Db2 | Db2 LUW, a debug-enabled SQL PL procedure, the required debugger roles and privileges, and reverse callback reachability |
| Oracle | Thin mode, classic DBMS_DEBUG, DEBUG CONNECT SESSION, and a standalone routine compiled with debug and PL/Scope metadata |